WILMINGTON, N.C. (Aug 10, 2017) July 2017 sales and listing data has been published by the Cape Fear REALTORS® and is now available here.
Neal Johnson, 2017 CFR President responded to the data:
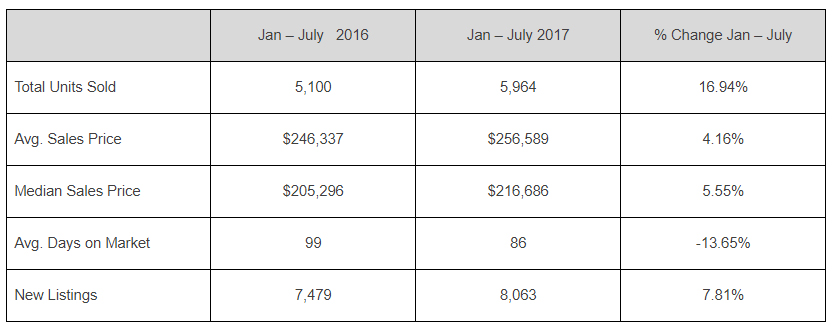
“Growth continues for our housing market across the Cape Fear Region, fueled by the low supply levels of homes and the increasing demand. The CFR* Market * has another RECORD setting month for July 2017 with 940 units sold, Best July Ever!, up 7.8% from last year. Average home sales price was $258,758 in July 2017, which was 4.89% greater than that in July of 2016. From January to July 2017 (YTD) numbers continue to be just as strong when compared to the same period in 2016. Total sold units rose 16.94%; average sales price rose 4.16%, total sales volume increased 21.85%.
In New Hanover County**, the average home sales price for July 2017 was $293,602 or 9.13% higher than that in July 2016; this is up 7.4% YTD from 2016. In July 2017 456 units sold, this is down 6.2% from July 2016 but up 5.6% YTD. The monthly supply level of homes in July 2017 has shrunk to 4.22 months. BREAKDOWN: Homes under $300K represent a majority of sales or 66% of the total sales. This group has a 2.57 months supply of homes, making this a strong Seller’s Market. Homes $300K to $499K represent 24.8% of the sales market and have a 5.99 months supply, making this a Balanced Market. Homes $500K to $749K represent 5.48% of the market and have 15.05 months supply. Homes $750K and above represent 3.07% of all sales and have a 12.33 months supply. Both these groups are in a Buyer’s Market.
In Pender County**, the average home sales price for July 2017 rose 7.92% to $274,657 compared to that in June 2016; this is up 8.02% YTD from 2016. In July 2017 138 units sold, this is down 8% from July 2016. The monthly supply for July 2017 is 5.4 months. BREAKDOWN: Homes under $300K represent 73% of the total sales in Pender County and have a 3.57 months supply, making it a Seller’s Market. Homes $300K to $499K represent 23.2% of the sales market and have an 8.1 months supply, making it a Balanced/Buyer’s Market. Homes $500K to $749K represent 1.5% of the sales market and have a 16 months supply. Homes $750K and above represent 2.9% of all sales and have a 13.7 months supply. Both these groups are in a Buyer’s Market.
In Brunswick County**, the average home sales price for July 2017 rose 3.5% to $249,711 when compared to June 2016; this is up 8% YTD from 2016. In July 2017 435 units sold, up 19.5% compared to last year, YTD unit sales are up a commanding 26.3% over last year. The monthly supply level for July 2017 is 6.4 months in Brunswick County. BREAKDOWN: Homes under $300K are 74% of the total sales and have a 3.2 months supply, making it a strong Seller’s Market. Homes $300K – $499K represent 18.85% of the sales market, there is a 9.14 months supply. Homes $500K to $749K represent 5.75% of the sales market, with a 12.71 months supply. Homes $750K and above represent 1.38% of all sales and have a 15.33 months supply; all three groups are in a Buyer’s Market. “
CFR* Market Numbers to note: