August 2017 Wilmington Home Sales Statistics
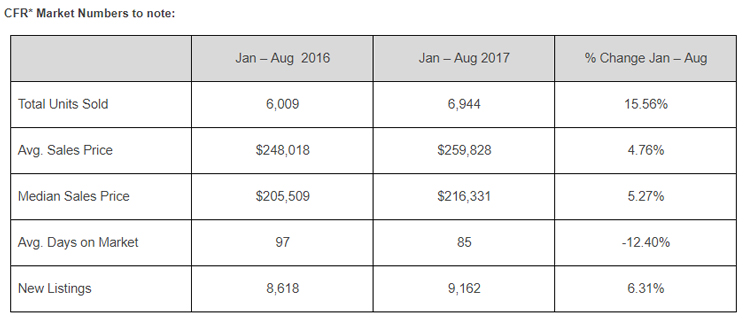
The CFR Market **, has another strong month in AUG 2017 with 967 units sold, Best August Ever! The average home sales price was $281,518 in AUG 2017, or 13.25% higher than that in AUG 2016. From January to AUG 2017 (YTD) numbers continue to be just as strong when compared to the same period in 2016. Total sold units rose 15.56%; average sales price rose 4.76%, and total sales volume increased 21.11%.
In New Hanover County**, the average home sales price for AUG 2017 was $336,040 or 13.25% higher than that in AUG 2016; this is up 8.32% YTD from 2016. There were 475 units sold in AUG 2017, this is down 4.8% from AUG 2016 and up 4.2% YTD. The monthly supply of homes in AUG 2017 has shrunk to 4.11 months. BREAKDOWN: Homes under $300K represent a majority of sales or 62% of the total sales. This group has a 2.6 months supply of homes, AUG sales were down 15% compared to AUG 2016. Homes $300K-$499K represent 26% of the sales market and have a 4.8 months supply, sales were up 10% from AUG 2016. Homes $500K – $749K represent 8% of the market and have 6.9 months supply, sales were up 80% from AUG 2016. Homes $750K+ represent 4% of all sales and have a 11 months supply, sales were up 5% from AUG 2016.
In Pender County**, the average home sales price for AUG 2017 was $264,841 or 5.06% higher than that in AUG 2016; this is up 8.46% YTD from 2016 YTD. There were 125 units sold in AUG 2017, this is even with Aug 2016 and up 4.2% YTD. The monthly supply of homes in AUG 2017 has shrunk to 5.4 months. BREAKDOWN: Homes under $300K represent a majority of sales or 71% of the total sales. This group has a 3.38 months supply of homes, AUG sales were up 6% compared to AUG 2016. Homes $300K-$499K represent 22% of the sales market and have a 10.27 months supply, sales were down 21% for AUG 2016. Homes $500K-$749K represent 5% of the market and have 11.4 months supply, sales were up 20% from AUG 2016. Homes $750K+ represent 2% of all sales and have more that 12 months supply, sales were up 200% from AUG 2016.
In Brunswick County**, the average home sales price for AUG 2017 was $273,108 or 5.72% higher than that in AUG 2016; this is up 7.64% YTD from 2016 YTD. There were 518 units sold in AUG 2017, this is up 30% from AUG 2016 and up 27.1% YTD. The monthly supply of homes in AUG 2017 has shrunk to 6.1 months. BREAKDOWN: Homes under $300K represent a majority of sales or 71% of the total sales. This group has a 3 months supply of homes, AUG sales were up 31% compared to AUG 2016. Homes $300K-$499K represent 19% of the sales market and have a 6.8 months supply, sales were up 9% from AUG 2016. Homes $500K-$749K represent 7% of the market and have 7.1 months supply, sales were up 131% from AUG 2016. Homes $750K+ represent 3% of all sales and have a 15 months supply, sales were up 140% from AUG 2016.
* data courtesy of WRAR